GSM Cell Graphing
|
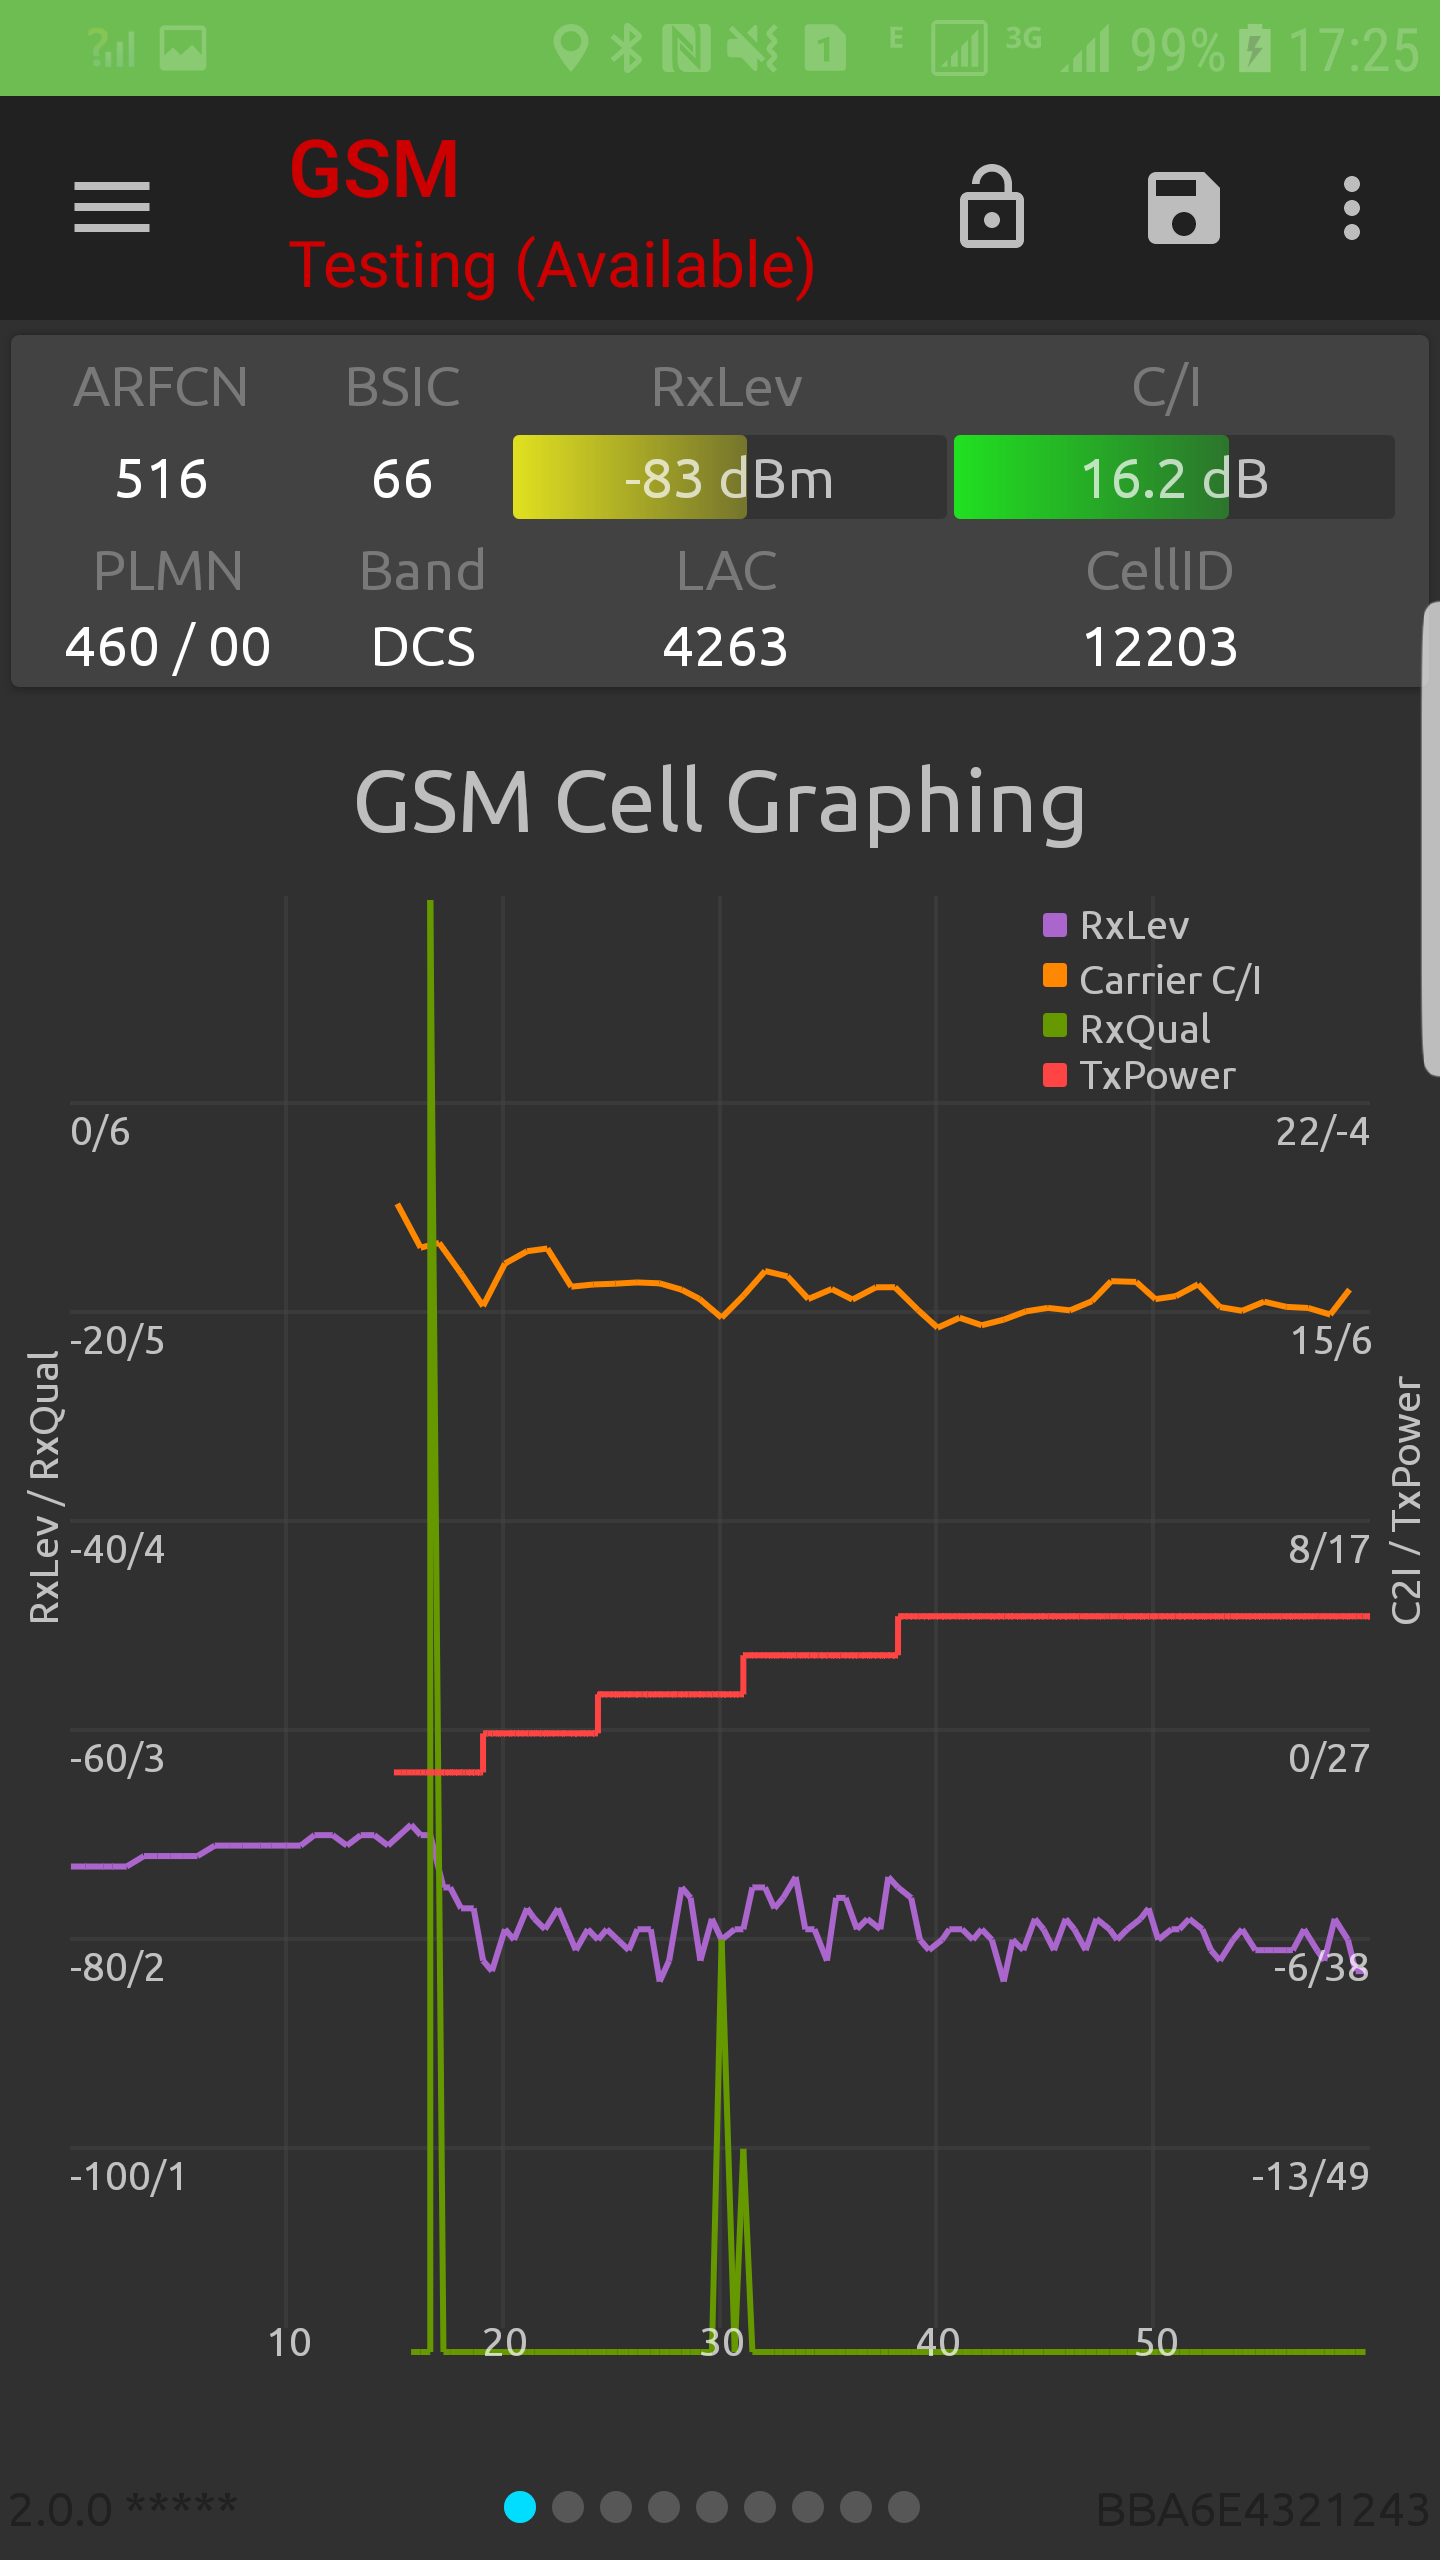
GSM Cell Graphing The chart shows the latest 60 seconds. Each label “<n>” on the x-axis means “n seconds ago”. The y-axis has both dBm and RxQual unit scale marks. RxLev: Indicates the value of received signal strength (RxLev) measured by the mobile on the "camped" cell in the idle mode. RxLev Sub: RxLev of strongest neighbor (dBm). Carrier C/I: Carrier Interference RxQual Full: Serving Cell RxLev Full range 0..7 (for example, 2). This indicates the value of bit error rate class represented by RxQual measured by the mobile for the serving cell when in call and averaged for all the samples over the previous SACCH period. RxQual Sub: Indicates the value bit error rate class represented by RxQual measured by the mobile for the serving cell when in call. The sub average comprises of a subset of samples on the mandatory bursts within the SACCH period. The range of RxQual Sub is 0-7. |